Testing the AF sensor array
– Whitepaper / Technical Study –
Falk Lumo [LumoLabs (fl)]
|
Version: |
Sep 13, 2012, v1.0 |
|
Status: |
Final |
|
Print version: |
www.falklumo.com/lumolabs/articles/D800Focus/SensorArray.pdf |
|
Publication URL: |
www.falklumo.com/lumolabs/articles/D800Focus/SensorArray.html |
|
Public comments: |
This technical study describes a method for checking if a camera's entire AF sensor array works as advertized. It can be used for almost any camera with a phase AF system, i.e., SLRs and SLTs. In fact, this paper contains examples for two Nikon and one Canon camera.
A main purpose of this paper is to check if a Nikon D800, D800E or D4 are working as advertized. More about this has previousy been published here:
1. Background
Unfortunately, such a check seems to have become suitable after it is now possible that many such cameras manufactured so far (Aug 2012) suffer from bad functioning left AF sensors. Especially as Nikon remained silent about the issue and returned many cameras sent to service "as fixed" while further inspection revealed they're not. Furthermore, without a statement from Nikon there remains substantial doubt that a camera "fixed" in service (e.g., calibrated for every AF focus point sensor) performs as well as a camera which was manufactured according to standards in the first place. There are more recent rumors that Nikon may meanwhile have dispatched a service procedure to more reliably fix the issue in service.
Therefore, such a check may now be advisable with multiple lenses. Maybe, Nikon could use our method with multiple lenses to document the performance of a camera after servicing for affected customers. Last but not least, the protocol from this method may be a good measure to preserve the value of early D800 on the used market place.
2. Reikan Focal
In order to make the testing procedure published in the article cited above (/lumolabs/articles/D800Focus/OuterSensors.html) as automated, meaningful and quick as possible, Rich (the author of Reikan's FoCal software) and myself decided to work together and enable buyers of SLRs to check their cameras if in doubt.
I fully endorse the FoCal software and Rich deserves any support from us so he can continue to make his software even more powerful. Note that I have no benefit in making this statement but the purchase of FoCal Pro was the best purchase I did in a long time.
FoCal is an automated software which via USB determines the optimum AF manual adjustment (AFMA) aka AF fine tune parameter for a given lens. In order to check the full sensor array you'll need the Pro version as it includes the Multi Point Focus Test tool (http://www.reikan.co.uk/focalweb/index.php/tests/multipoint-focus-test). It currently sells for 70 GBP (cheaper versions are available but they lack support for the array test). If your camera is affected by the defect, ask Nikon for a refund to make them feel guilty at least ;) After all, they claim that only a small number of D800s are affected which definitely is a false statement (only explained by the fact that most customers don't return their camera in lack of a procedure to reliably fix the defect or exchange for an unaffected one).
If you're already a customer, you need to update to version 1.6.0 (or later). This version and its features are described here:
In the following, I am going to describe how to use this software for the given task and what results to expect.
3. Best practice
The following is a best practice method which I also had in mind when working together with Rich to make version 1.6 happen. Some people have reported issues to get version 1.6.0 to work properly. I didn't notice any significant issues though. I follow the following steps:
-
Purchase (or update) FoCal Pro 1.6+ (www.fo-cal.co.uk).
Note: you can register for up to five camera bodies and change registration up to 10 times. So, you only should need to pay once even if shuffling bodies ;) -
Print out the target image (FoCal_MultiFocus_Target_1r1ns.pdf (or .png)).
Note: Print out 3 or 12 copies if using 8x11" or Din A4 paper, then cut away the blank borders, then glue a row of 3 sheets (in portrait orientation), or two rows of 6 sheets (all in portrait orientation) resp., onto a wall or board. Inkjet is better but laser does ok if illuminated from the sides.This gives you a target roughly appropriate to test at a distance of approx. 25x (3 sheets) or 50x (12 sheets) the focal length. 50x is the common vendor recommendation (if you have to fight your case) but I found that 25x roughly gives the same results for the given problem.
The following is a snapshot from a possible setup using 12 sheets of the target:
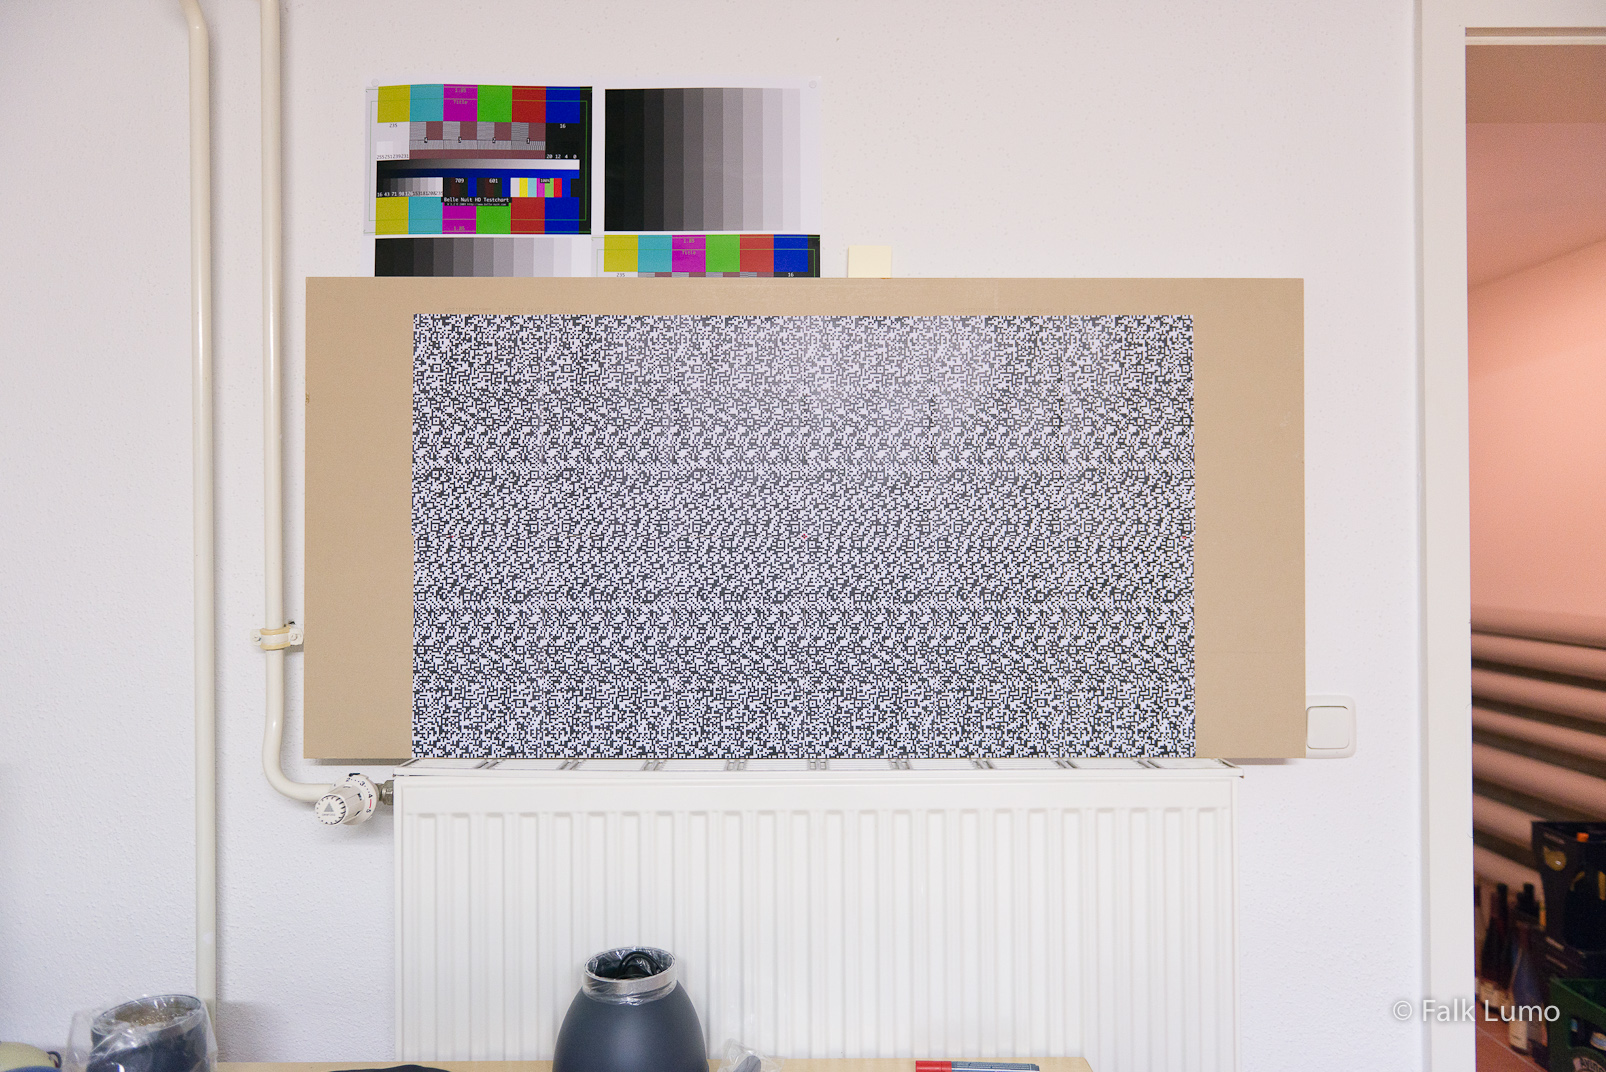
Use FoCal's "Target Setup" feature to adjust distance such that the full target just fills the area covered by the AF sensor points (the red shaded area in the target setup window). Of course, some care should be applied to have the target be perpendicular to the camera lens axis. One method to make sure it is, is to fix a small mirror to the center of the target and verify that the lens appears in its middle when watching live view. Also, try to illuminate the target from both sides to avoid reflections (halogen does just fine). You can enter the light's color temperature into FoCal if you're a perfectionist.
-
Open FoCal, select camera, open "Show Tools", then "Multi Point Focus Test".
Select the AF points you want to test for (I usually select five points: the outermost, the overnext neighbors towards the middle, and the center point). Make sure to include the center AF point. Use "Target Setup" to verify that all selected focus points match the test target (red area).
Tick AFMA: From: -20 To: 20. But I recommend you use Count: 6 steps (rather than 5).
Tick Validate Focus Consistency to 2 percent (rather than 6 % and unticked).
Note: the standard "Multi Point Focus Test" will not change the AFMA value and its result depends on too many variables to be useful.
Start the test.
Note: with some cameras, you'll have to manually enter an AFMA value using the camera's menu six times throughout the entire test. The rest is automatic.
-
Save the report (PDF).
The relevant output is the single chart entitled "Best AF Fine Tune" on page 3 of the report.
We are going to call the colors in this chart the "AFMA array color chart" (A2C2).
Note: Due to a bug in version 1.6.0 of FoCal, the plotted AFMA values are truncated to one digit (negative) or two digits (positive) in this report. Therefore, the numbers are to be ignored. Use a screenshot of the FoCal window after the test is complete to obtain more correct numbers. However, the color encoding is correct and I will only refer to colors in this chart in the remaining part of this article, i.e., I'll refer to the A2C2.
Note: The color is blue or red if the difference of the AFMA value to the center point exceeds 10. So, by definition, the center point is green always. The color is green, cyan or yellow if the difference is 10 or smaller.
-
Interprete the result:
No color in the A2C2 should be red or blue (for an f/2.8 lens).
For AF points which came out red or blue, verify that the result is plausible by checking the interpolation curve for all tested AFMA values further down in the report. It should exhibit a clear maximum at the left or right edge or even outside the chart.
It seems to be normal to have a few AF points which turn out cyan or yellow.
Note: Read section 4.4 for a direct comparison between results for Nikon and Canon.
Note: The color-coded A2C2 chart is independent of the lens resolution, the camera (sensor) resolution, the lens' border sharpness, the exact focus distance, focal length, aperture used during testing, field curvature, other lens aberrations, uneven illumination, slight tilting of the target, etc. This is why A2C2 like no other chart is so useful to check for the issue. However, it is (or may be) dependent on a lens' widest aperture and the camera make (cf. below).
I.e., while the perceived problem may be most prominent with a fast wide lens, it will show with probably any lens in the A2C2.
Note: At least for Canon, the AFMA values seem to scale proportional with the nominal lens aperture, i.e., its widest aperture. Therefore, AFMA values for an f/1.4 lens may be twice the values as for an f/2.8 lens (for the same absolute defocus error). If true (for a given vendor), then the A2C2 interpretation is only valid for an f/2.8 lens: with f/1.4, larger deviations would be acceptable and for f/4 or f/5.6 lenses, tighter tolerances would be required to be acceptable (i.e., an all green A2C2).
Note: Because Canon seems to use a more fine grain AFMA scale (by a factor of 2 or more), an A2C2 chart for Canon should remain all green even for an f/2.8 lens.
Note: I found that the central AFMA value can change if the test is repeated after the camera was used meanwhile. But this doesn't seem to affect the A2C2. While the individual AFMA values may change by more than +/-2, the difference to the center seems to be more stable.
-
Consult Nikon service:
A Nikon camera with A2C2 in red or blue (for an f/2.8 lens) needs to be serviced.
4. Sample results
4.1. Nikon D800E
The following results are from a D800E which previously was evaluated and found to be affected by the "leftmost AF sensor issue". I consider this particular body to be rather typical for the bulk of D800 cameras manufactured during the first few months. It needs to be serviced but as of now, is in its state as delivered.
4.1.1. Nikkor 24-70/2.8G
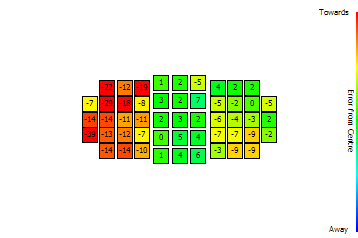
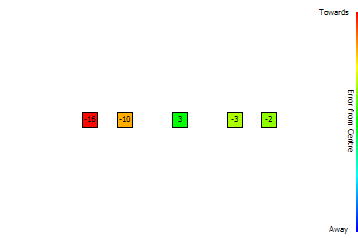
Fig. 1 A2C2 (AFMA array color chart) D800E/24-70/2.8G at 24 mm and 1.20 m distance (50 x).
Above: full chart, below: second run for select points. While the exact AFMA values fluctuate a bit, the overall colors do not.
Here is the link to the full PDF report for the upper chart:
→ www.falklumo.com/lumolabs/articles/D800Focus/images/array/D800E_24-70f_28G
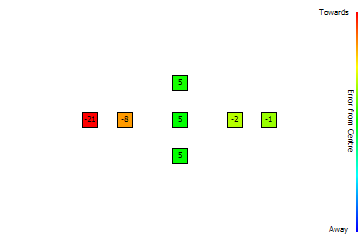
Fig. 2 A2C2 D800E/24-70/2.8G at 24 mm and 0.60 m distance (25 x).
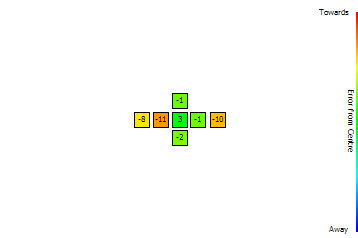
Fig. 3 A2C2 D800E/24-70/2.8G at 24 mm and 2.40 m distance (100 x).
Note that this was too far away to cover the entire AF array. However, note that the central area does look worse than at 1.20 m. This may be an indication that the AF accuracy decreases with increasing distance. However, at 100x the focal distance (which is the case here), the difference between -11 and -4 is barely perceivable and the measurement would probably have to be repeated to be accurate enough (the classic depth of field is already almost as large as the distance).
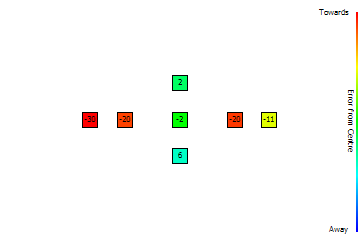
Fig. 4 A2C2 D800E/24-70/2.8G at 70 mm and 2.40 m distance (34 x).
The secondmost right AF point measures as -20, but the data wouldn't exclude -10 too. Nevertheless, the result looks a bit worse than at 24 mm and so, it doesn't seem to be a wide angle only issue.
Overall, the results with this lens are not very dependent on the actual focal length or focus distance. For larger than ~70 x focal distance, the AF system seems to have additional accuracy problems which however are masked by the fact that the increasing depth of field then doesn't require utmost precision anymore.
The middle AF bank is ok, the left bank is junk and the right bank is acceptable (just).
4.1.2. Nikkor 14-24/2.8G
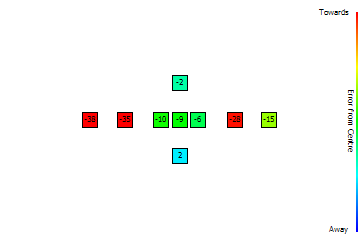
Fig. 5 A2C2 D800E/14-24/2.8G at 14 mm and 0.60 m distance (43 x).
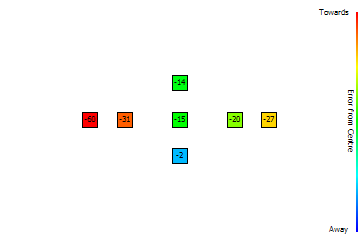
Fig. 6 A2C2 D800E/14-24/2.8G at 24 mm and 0.60 m distance (25 x).
Overall, the results with this lens are similar to the 24-70. However, probably partly due to the high center calibration (~ -10) necessary for this lens, the results look a bit worse overall and the central bank shows some weakness too.
4.1.3. Nikkor 70-200/2.8G II
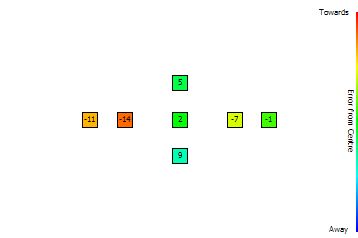
Fig. 7 A2C2 D800E/70-200/2.8GII at 70 mm and 2.40 m distance (34 x).
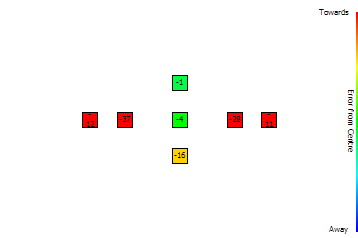
Fig. 8 A2C2 D800E/70-200/2.8GII at 200 mm and 2.40 m distance (12 x).
The results with this lens are similar to the 24-70 again, esp. at 70 mm. However, probably partly due to the close distance (12 x), the results look a bit worse overall. Interestingly, at 70 mm, the leftmost AF point wasn't the one performing worst. But the left bank is definitely is not accurate enough with this lens too.
Overall, the results are similar on a qualitative level. The dependence on distance (at least between 25 x and 50 x) seems to be weak, followed by the dependence on the focal length used. The largest dependence seems to be on the actual lens used.
As a rule of thumb, if the A2C2 chart has red spots for an f/2.8 lens, then it may have them for all such lenses. Also, the outer leftmost AF point isn't necessarily the worst one. The other AF points nearby can be equally bad or worse even. So, it is a good idea to test for more than one AF point per bank.
4.2. Nikon D3
4.2.1. Nikkor 24-200/2.8G
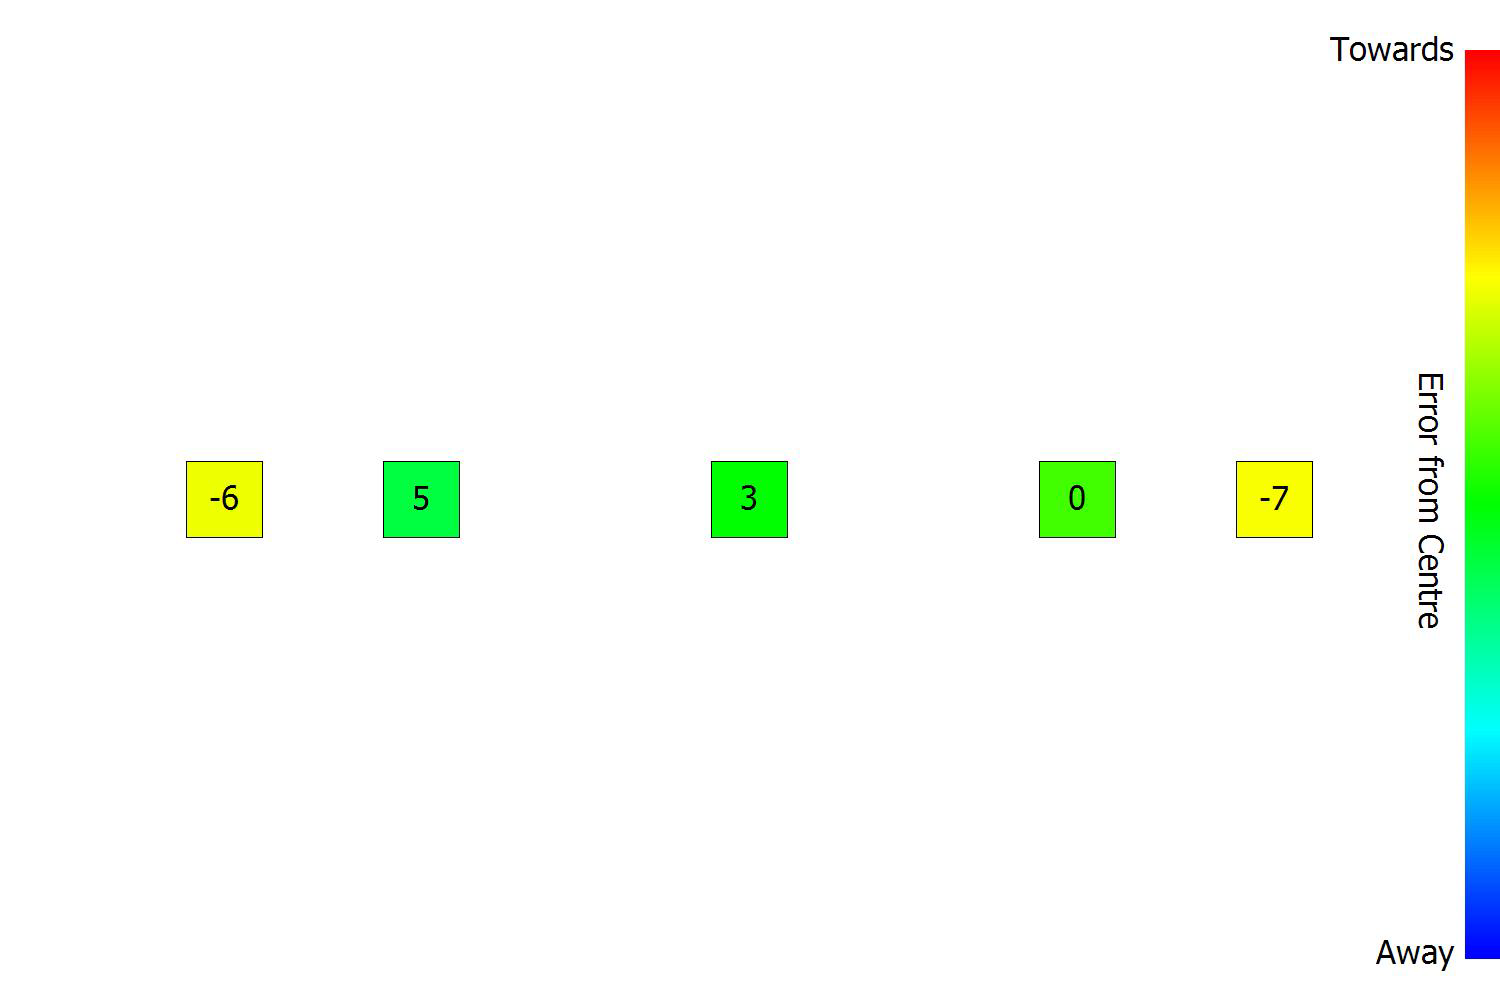
Fig. 9 A2C2 D3/24-70/2.8G at 24 mm and 1.20 m distance (50 x).
4.2.2. Nikkor 50/1.4G
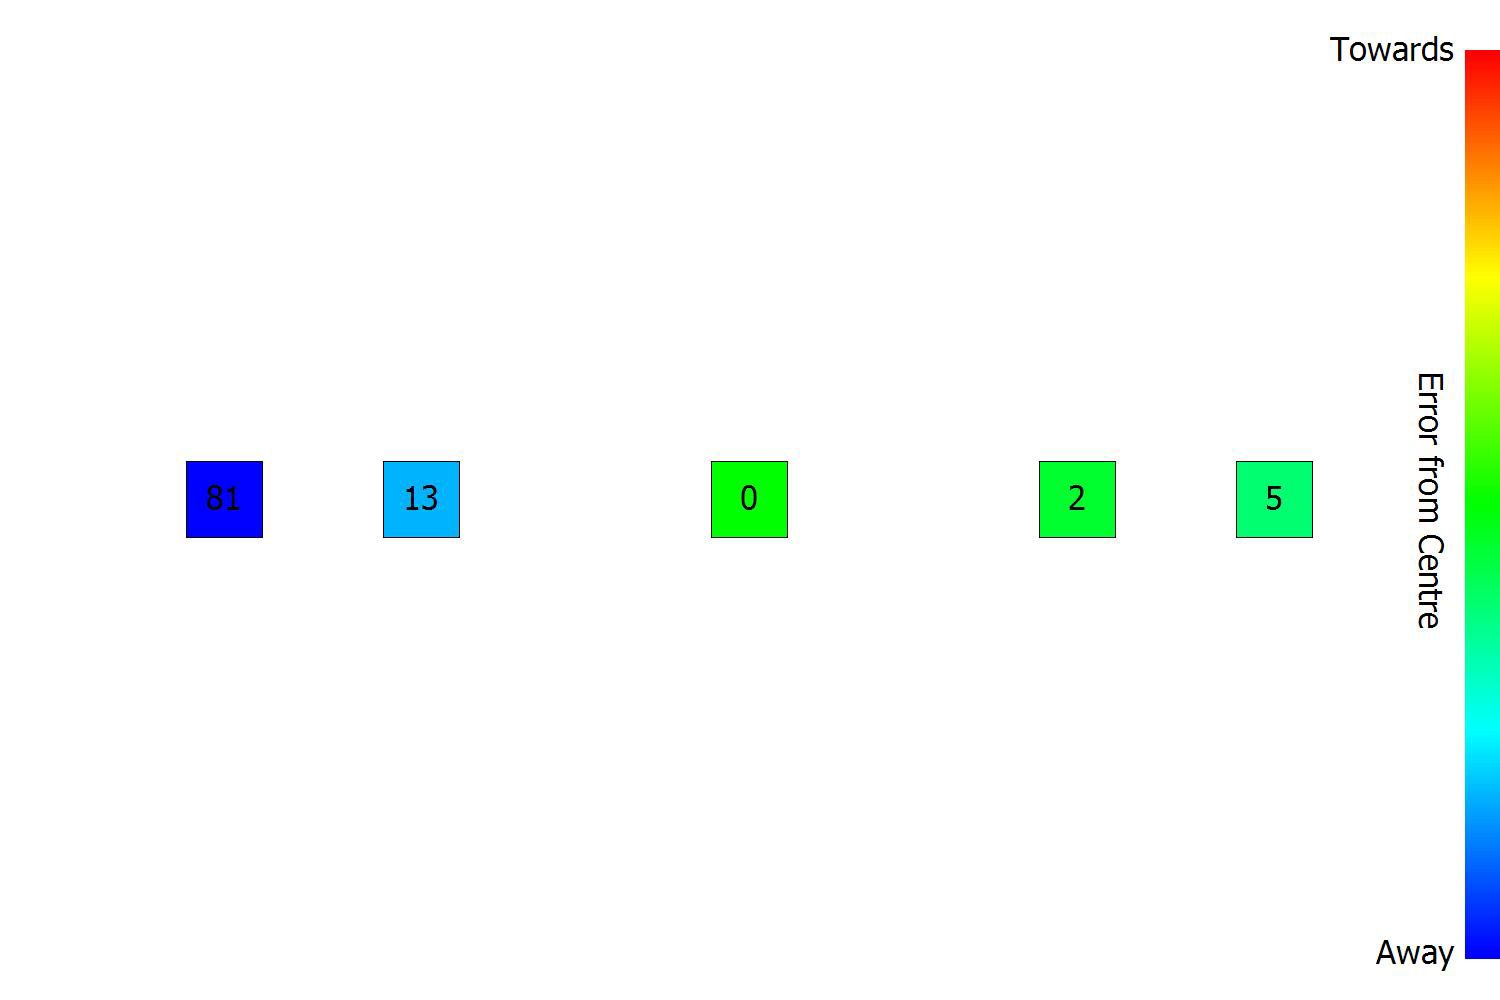
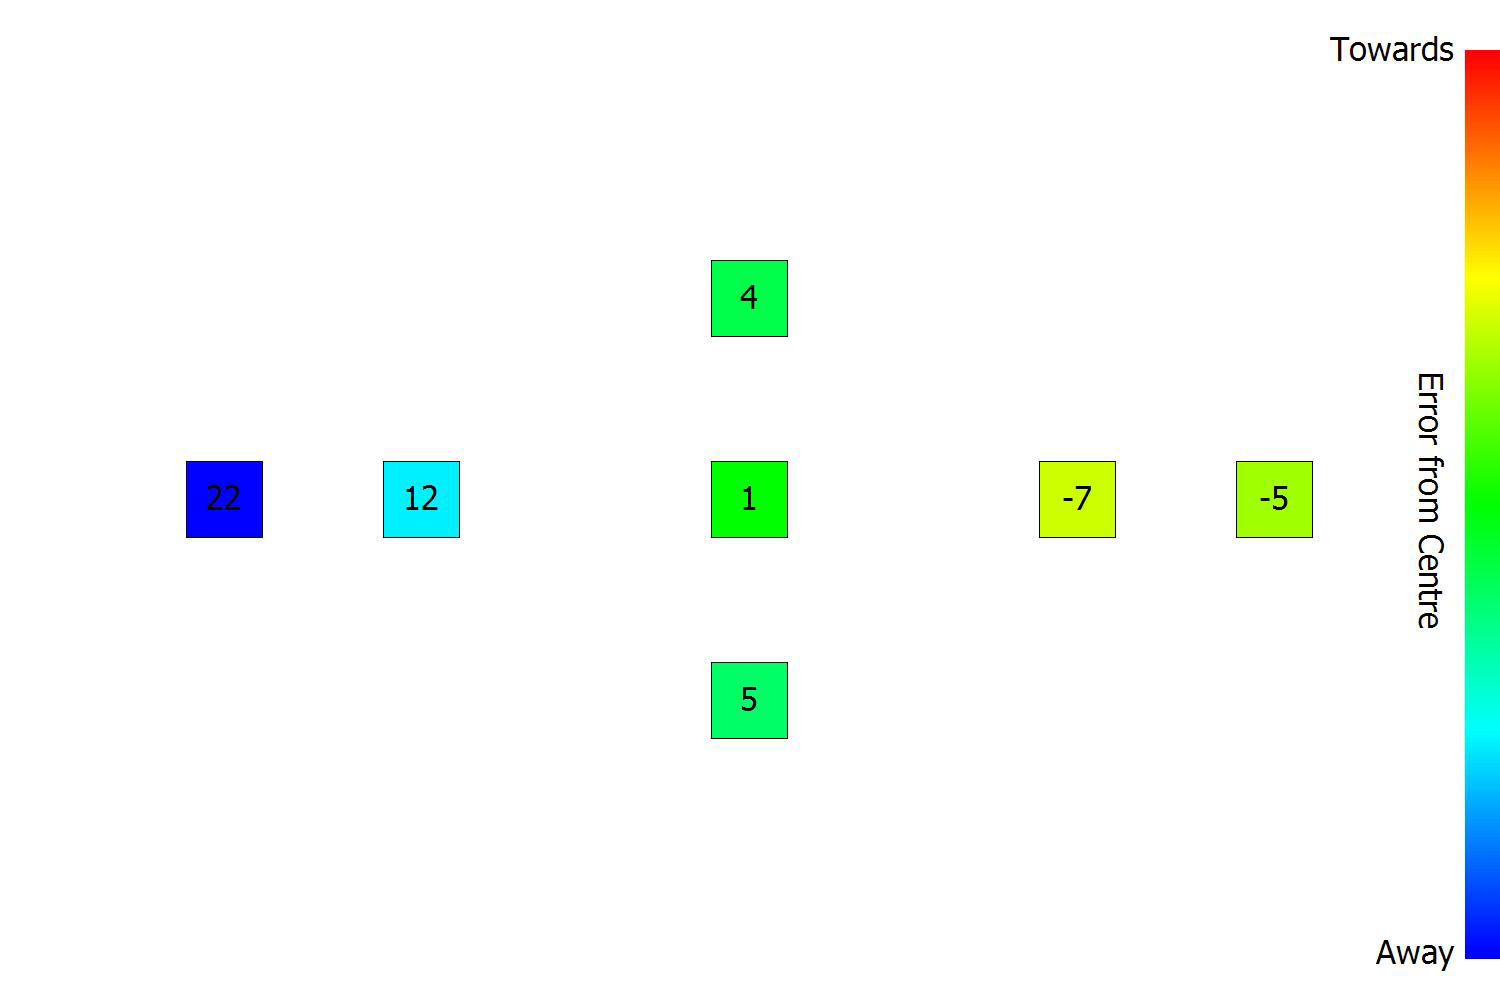
Fig. 10 A2C2 D3/50/1.4G at 50 mm and 1.20 m distance (24 x). F1.4 chart!
The upper part shows the measurement done at f/2.8, the lower part done at f/1.4. At f/1.4, the depth of field is smaller and therefore, the dependency of focus changes is larger. But at the same time, lens softness makes it hard to accurately determine the AFMA value towards the edges. Nevertheless, the A2C2 is close enough to be deemed consistent.
I currently believe that AFMA values determined for an f/1.4 lens are twice the values as determined for an f/2.8 lens. This would be in line with what Canon once said how it defines the AFMA scale: as fractions of shift on the image side to travel a lens' depth of field.
Therefore, above values would have to be divided by two. This yields a max. deviation of 10 which is the same as for the 24-70 lens. Only difference is the asymmetry which the 24-70 test didn't show. Also, the direction is opposite. Maybe, this 50 is a slightly decentered sample, who knows (however, the absolute quality of focus left and right have been about the same).
4.3. Canon 7D
4.3.1. Sigma 10-20mm F4.0-5.6 EX DC / HSM
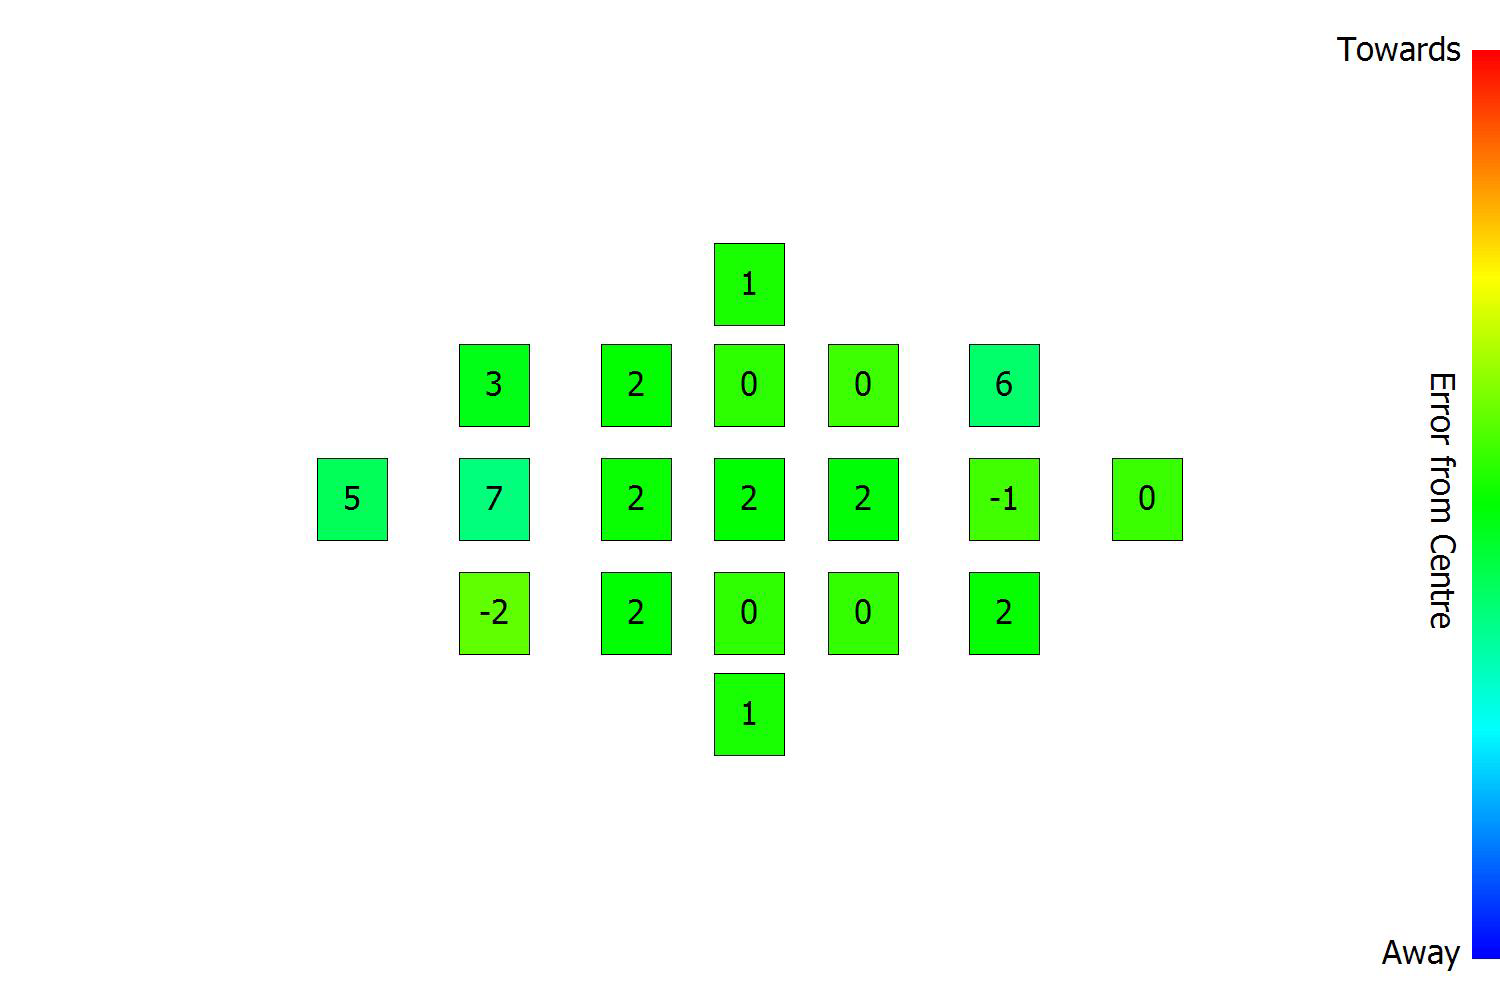
Fig. 11 A2C2 7D/10-20/4.0-5.6Sigma at 17 mm and 0.80 m distance (47 x). F4.0-5.6 chart!
This chart shows an "all fields green" result which is great. However, we have to keep in mind that defocus AFMA values (for Canon) scale with a lens nominal aperture. At 17 mm, this lens has f/5.6 as its widest aperture but let's assume for a second that the scale factor used is by lens, i.e., 4.0/2.8 or 1.4.
Therefore, the larger deviations become 7 rather than 5. Applying a Canon/Nikon ratio of two (cf. section 4.4 for a direct comparison between results for Nikon and Canon), 7 becomes 14 (orange). So, despite the nice green color, the above chart doesn't mean the camera's AF constency is better than the measured D3.
Also, to be fair, the 7D isn't full frame and it's AF module covers a smaller area than Nikon's full frame AF modules (if expressed in absolute terms (mm) in the focus plane). But then, it is cheaper too.
4.4. The AFMA scale
For any given camera, it is possible to establish a relationship between the best AFMA value (as determined by fine calibration) and the defocus error without fine calibration (as expressed by the shift of the focus plane against the sensor plane, a number in µm).
Or in other words, to relate the dimensionless unit step in a change of AFMA with a shift of the focus plane in physical dimensions, expressed in µm.
I believe that this relation is universal for a given AF module, probably for a given vendor and sensor size. And it may or may not be proportional to a lens' nominal (aka widest) aperture (it probably is).
4.5. Nikon
For the D800E, I measured the (MTF50-related) resolution (expressed as LW/PH) as a function of adjusted AFMA value (cf. Fig. 12).
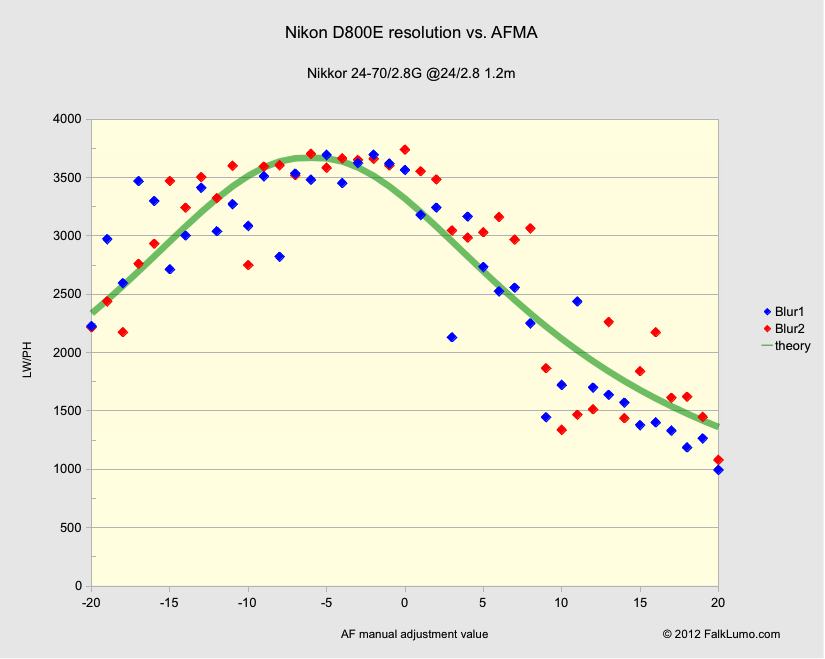
Fig. 12 D800E resolution in LW/PH (determined from slanted edge 10-90% rise width) as a function of AF manual adjustment value AFMA, as determined for the central AF focus point and with a Nikkor 24-70/2.8G lens at 24mm f/2.8 at 1.2 m distance.
The measurement was executed twice and the results are plotted in two different colors. Unfortunately, the D800E's internal default JPG sharpening is too much to reveal much detail around the peak. The scatter of AF precision can be pragmatically expressed as a variation of about +/-4 on the AFMA scale. For a well calibrated lens, this has no effect on visible sharpness as it is almost flat over a region of about 10. This is a first hint that a change of AFMA of 1 is a small change only.
Nevertheless, it is still possible to determine the parameters of the theoretical curve (green line). It corresponds to:
Peak at AFMA: -6 (+/-1)
Focus shift per AFMA unit change: 3.4 µm (for an f/2.8 lens)
The theory of how to derive the focus shift from resolution changes is at
www.falklumo.com/lumolabs/articles/sharpness/index.html §2.3.4.
However, I should mention that the above result has a significant systematic error (maybe +/-50%) because we did not calibrate the method for the actual in-camera JPG sharpening parameters.
The above result can be translated to the following change of the circle of confusion:
An AFMA unit step for Nikon changes the diameter of the resulting circle of confusion (CoC) by ~1.2 µm which is ~1/25 of the acceptable CoC (30 µm as used in depth of field (DoF) calculations).
Values of 1 µm (1/30) or 1.5 µm (1/20) are within systematic error bounds.
This means that the AFMA range of -20 … 20 does almost span the full depth of field range. However, the systematic errors allow for a full coverage of depth of field (1/20) or for 1.0 µm change per unit change (1/30, a focus shift of N µm where N is the F-stop number).
This means that an AFMA unit change is a smaller focus shift for a fast lens, and a larger one for a slow lens, as shown below (the conservative, larger value of 1/20 was used for Nikon):
|
Focus shift df per AFMA unit change |
Nikon APS-C |
Nikon FF |
Canon APS-C |
Canon FF |
|
F/1.4 |
2.1 µm ? |
2.1 µm |
3.5 µm ? |
5.3 µm ? |
|
F/2.8 |
4.2 µm ? |
4.2 µm |
7.0 µm ? |
10.5 µm ? |
|
F/4.0 |
5.9 µm ? |
5.9 µm |
10.0 µm ? |
14.8 µm ? |
|
F/5.6 |
8.4 µm ? |
8.4 µm |
14.0 µm ? |
21.0 µm ? |
Because a phase AF module doesn't become more accurate just because the lens has a larger nominal aperture, this means that a faster lens needs larger correction values and shows larger fluctuations in determined AFMA values. This dependency on nominal aperture is published for Canon and assumed behaviour (by me) for Nikon.
4.5.1. Reikan Focal 1.6 and its quality of focus Q
It is interesting to compare Fig. 12 with the corresponding FoCal chart:
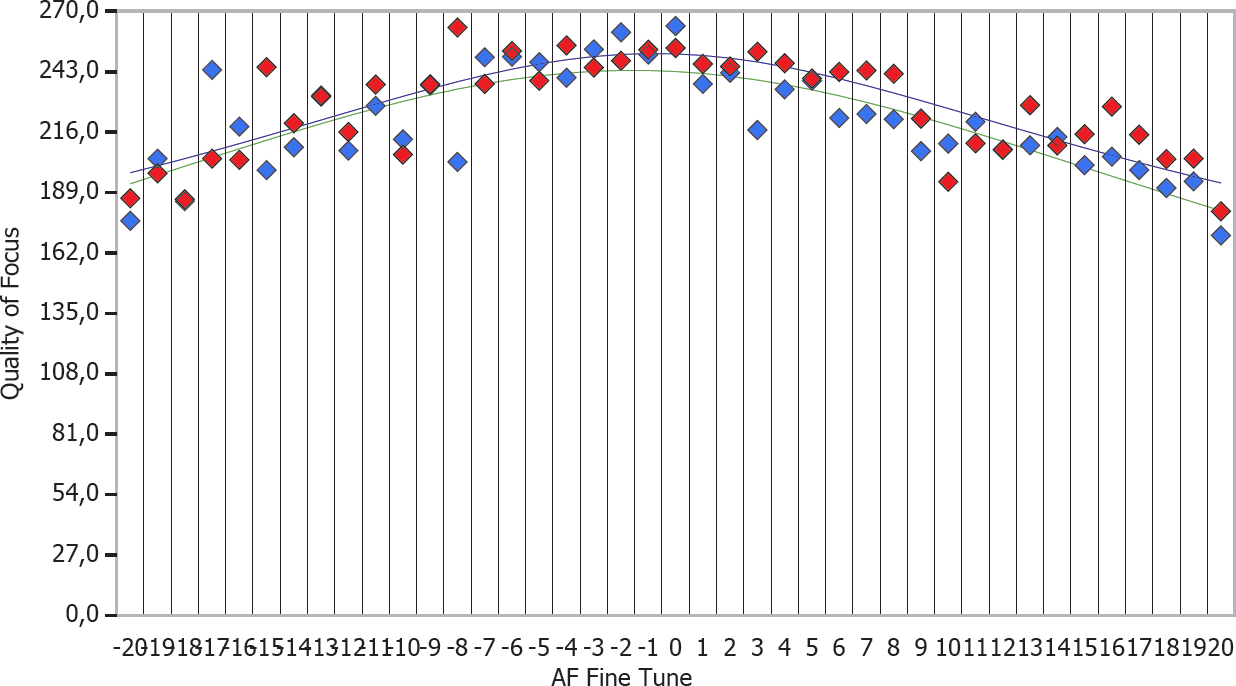
Fig. 13 D800E resolution as FoCal Quality of Focus Q, for same data points as in Fig. 12.
To be fair, it should be noted that the target used was not optimal for the algorithm used by FoCal. But the smaller drop of Q towards higher deviations of AFMA is typical still.
Peak at AFMA: -2 (+/-1)
Because FoCal determines a slightly different AFMA value (-2 rather than -6) and its Q curve looks symmetric while the resolution curve does not, we will have a direct look at the results at AFMA = -20 and 20 (cf. Fig. 14).
Fig. 14 Test shot at AFMA=-20 (left, top) and AFMA=+20 (right, bottom).
At +20, the shot looks significantly less sharp (you may want to look at the samples in full resolution).
The direct inspection reveals that our resolution determination is accurate and the FoCal Q measure struggles as blur increases. Reikan knows about this issue and is working on that though. For the time being, its effect on determination of the optimum absolute AFMA values is small (esp. with the proper FoCal target and distance) and on the A2C2 chart is even smaller.
4.6. Canon
During the work with Reikan, I also tried to experimentally determine this value for a Canon 7D with a 100mm f/2.8 lens.
Unlike Nikon (as far as I know), Canon has made a statement about how to interprete the AFMA values. This and its dependency on a lens' full aperture was communicated in
→ learn.usa.canon.com/resources/articles/2011/af_microadjustment_article.shtml .
Unfortunately, I only had two blur values to work with. With some handwaving arguments, I derive at the following increment of the circle of confusion CoC per AFMA unit change: 2.1 µm or 1/9.4 of the APS-C 20 µm full circle of confusion at the edge of depth of field.
This is close enough to 1/8 and makes me belief that Canon's statement applies to 1/8 the CoC rather than DoF (it would have to read 1/16 of DoF then). This is reflected in the statement below and the table above:
An AFMA unit step for Canon changes the diameter of the resulting circle of confusion (CoC) by 1/8 of the acceptable CoC (as used in depth of field (DoF) calculations). This is 2.5 µm for APS-C and 3.75 µm for full frame.
So, the entire Canon scale -20 to 20 spans 2.5 x of the full depth of field. In the table above, I assume that Canon adapts the scale for APS-C while Nikon doesn't. But I don't really know! After all, the AF module doesn't magically become more accurate only because the sensor is smaller ...
My rule of thumb is that Nikon AFMA steps are more fine grain than Canon's: 2 or 3 Nikon steps may equal 1 Canon step. In the interpretation guidelines above, I used a factor of two between the two scales. But it may be any factor between 2 and 3.75.
A consequence is that I wouldn't expect determined AFMA values for Nikon to be as repeatable as for Canon: If a Canon value is accurate +/-1, the Nikon value may only be accurate +/-3 which spans a region of 6 AFMA unit steps. But my experience is that this is still an accurate enough micro adjustment for the Nikon AF. This means I don't advice to enable AF microadjustment for Nikon with AFMA values smaller than five.
5. Conclusion
The A2C2 (the AFMA array color chart) as produced by Reikan FoCal 1.6 Pro's Multi Point Focus Test tool (using the AFMA step option) is ideally suitable to check a camera for proper alignment of its AF module. As it is robust against most influences normally making an interpretaion of results difficult or impossible.
The phase AF modules shipping in today's cameras do only have limited accuracy. Based on experience with various cameras and testing situations (and the above derivation of absolute units), I say that calibration accuracy of individual AF fields against the central one is limited to about 40 µm, whatever be the camera or vendor. If you ask me, that's at least twice the value I would desire but it makes no sense to ask for more than the market delivers.
In practical terms, this means that when testing with an F/2.8 lens, the A2C2 chart for Nikon should be green, yellow and cyan only. And all green for Canon. This means that AFMA deviations from the central AF field should be smaller than 10 for Nikon and smaller than 5 – 7 for Canon. For an F/1.4 lens, AFMA deviations must be allowed to become twice as large. For slower lenses, AFMA deviations must remain smaller.
This is generally the case, Nikon and Canon alike.
However, it appears that up to now, the left bank of unserviced Nikon D800, D800E and D4 mostly emerge red in the A2C2 chart. Such cameras may require servicing from Nikon and the test may be used to verify the success of Nikon's work. Or claims that the issue was resolved in factory.